Trend / Prediction with RRDtool
I’ve not used RRDtool for a while and put back my attention on it few weeks ago. I found out that lots of new cool stuff are avalaible, like LSLSLOPE, LSLINT. These function return the parameters of the Least Squares Line (y = ax +b) approximating a dataset (LSLSLOPE return a, LSLINT return b).
This is interesting because with the function approximating your data you can graph a prediction of future data. Of course a Least Squares Line function will work best to approximate a dataset that tend to grow or shrink (like filesystem usage, memory usage, …) but not for data like temperature. I would say that if your data can be expressed in a percentage, an Least Squares Line can be fine. For data not tending to grow or shrink rrdtool provide some other function like TREND and PREDICT.
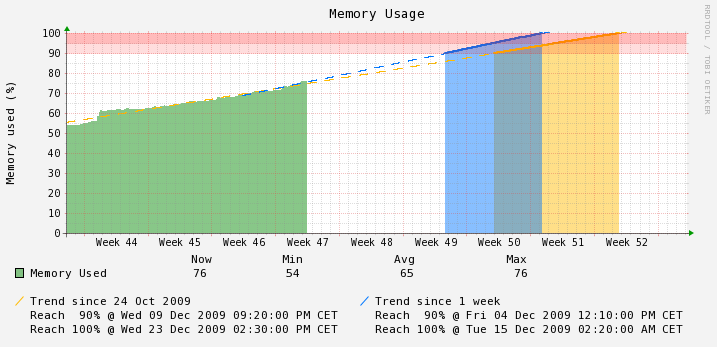
I will show how to use LSLSLOPE and LSLINT taking memory usage of a device as an example. My exemple will produce a graph like the following :

As you see, the graph show trend using two Least Squares Line function, one generated from the full dataset (dataset is starting 24 Oct 2009) and one generated only from last week data. Projection on time axis is done from 90% to 100% of memory usage and the date resulting of calculation for 90% and 100% of usage is displayed. I’ve seen lots of question asking how to do this but did not found any answer, so I hope that my example will provide an answer.
Here is the perl code I’m using to generate this graph. There is no Perl specific code, so it can be converted to a normal rrdtool command.
#! /usr/bin/perl
use RRDs;

$rrd_file = 'MEMORY.rrd';

RRDs::graph "MEMORY_Trend.png",
'--start', "10/24/2009",
'--end', "12/31/2009 00:00am",
'--title', "Memory Usage",
'--interlace', '--width=620', '--height=200',
"--color","ARROW#009900",
'--vertical-label', "Memory used (%)",
'--lower-limit', '0',
'--upper-limit', '100',
'--border','0',
'--rigid',

"DEF:used1=$rrd_file:used:AVERAGE",
"DEF:used2=$rrd_file:used:AVERAGE:start=10/24/2009",
"DEF:used3=$rrd_file:used:AVERAGE:start=-1w",
"DEF:used4=$rrd_file:used:AVERAGE:start=-2w",
"DEF:used5=$rrd_file:used:AVERAGE:start=-4w",
"DEF:free1=$rrd_file:free:AVERAGE",
"DEF:free2=$rrd_file:free:AVERAGE:start=10/24/2009",
"DEF:free3=$rrd_file:free:AVERAGE:start=-1w",
"DEF:free4=$rrd_file:free:AVERAGE:start=-2w",
"DEF:free5=$rrd_file:free:AVERAGE:start=-4w",

"CDEF:pused1=used1,100,*,used1,free1,+,/",
"CDEF:pused2=used2,100,*,used2,free2,+,/",
"CDEF:pused3=used3,100,*,used3,free3,+,/",
"CDEF:pused4=used4,100,*,used4,free4,+,/",
"CDEF:pused5=used5,100,*,used5,free5,+,/",

“LINE1:90″,
“AREA:5#FF000022::STACK”,
“AREA:5#FF000044::STACK”,

"COMMENT:                         Now          Min             Avg             Max\\n",
"AREA:pused1#00880077:Memory Used",
'GPRINT:pused1:LAST:%12.0lf%s',
'GPRINT:pused1:MIN:%10.0lf%s',
'GPRINT:pused1:AVERAGE:%13.0lf%s',
'GPRINT:pused1:MAX:%13.0lf%s' . "\\n",
"COMMENT: \\n",

'VDEF:D2=pused2,LSLSLOPE',
'VDEF:H2=pused2,LSLINT',
'CDEF:avg2=pused2,POP,D2,COUNT,*,H2,+',
'CDEF:abc2=avg2,90,100,LIMIT',
'VDEF:minabc2=abc2,FIRST',
'VDEF:maxabc2=abc2,LAST',

'VDEF:D3=pused3,LSLSLOPE',
'VDEF:H3=pused3,LSLINT',
'CDEF:avg3=pused3,POP,D3,COUNT,*,H3,+',
'CDEF:abc3=avg3,90,100,LIMIT',
'VDEF:minabc3=abc3,FIRST',
'VDEF:maxabc3=abc3,LAST',

"AREA:abc2#FFBB0077",
"AREA:abc3#0077FF77",
"LINE2:abc2#FFBB00",
"LINE2:abc3#0077FF",

"LINE1:avg2#FFBB00:Trend since 24 Oct 2009                      :dashes=10",
"LINE1:avg3#0077FF:Trend since 1 week\\n:dashes=10",
"GPRINT:minabc2:  Reach  90% @ %c :strftime",
"GPRINT:minabc3:  Reach  90% @ %c \\n:strftime",
"GPRINT:maxabc2:  Reach 100% @ %c :strftime",
"GPRINT:maxabc3:  Reach 100% @ %c \\n:strftime",

;

my $ERR=RRDs::error;
die "ERROR : $ERR" if $ERR;
Recent Comments