Trend / Prediction with RRDtool
I’ve not used RRDtool for a while and put back my attention on it few weeks ago. I found out that lots of new cool stuff are avalaible, like LSLSLOPE, LSLINT. These function return the parameters of the Least Squares Line (y = ax +b) approximating a dataset (LSLSLOPE return a, LSLINT return b).
This is interesting because with the function approximating your data you can graph a prediction of future data. Of course a Least Squares Line function will work best to approximate a dataset that tend to grow or shrink (like filesystem usage, memory usage, …) but not for data like temperature. I would say that if your data can be expressed in a percentage, an Least Squares Line can be fine. For data not tending to grow or shrink rrdtool provide some other function like TREND and PREDICT.
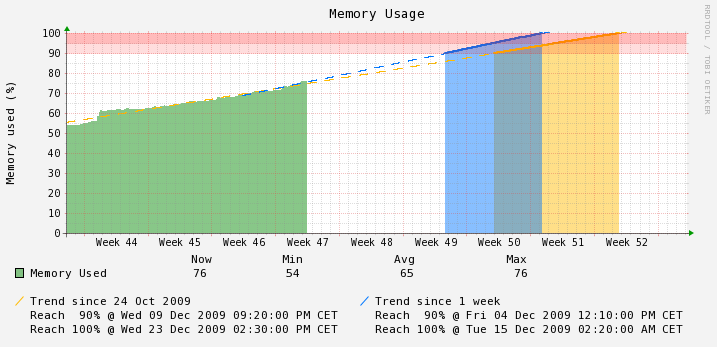
I will show how to use LSLSLOPE and LSLINT taking memory usage of a device as an example. My exemple will produce a graph like the following :

As you see, the graph show trend using two Least Squares Line function, one generated from the full dataset (dataset is starting 24 Oct 2009) and one generated only from last week data. Projection on time axis is done from 90% to 100% of memory usage and the date resulting of calculation for 90% and 100% of usage is displayed. I’ve seen lots of question asking how to do this but did not found any answer, so I hope that my example will provide an answer.
Here is the perl code I’m using to generate this graph. There is no Perl specific code, so it can be converted to a normal rrdtool command.
#! /usr/bin/perl
use RRDs;

$rrd_file = 'MEMORY.rrd';

RRDs::graph "MEMORY_Trend.png",
'--start', "10/24/2009",
'--end', "12/31/2009 00:00am",
'--title', "Memory Usage",
'--interlace', '--width=620', '--height=200',
"--color","ARROW#009900",
'--vertical-label', "Memory used (%)",
'--lower-limit', '0',
'--upper-limit', '100',
'--border','0',
'--rigid',

"DEF:used1=$rrd_file:used:AVERAGE",
"DEF:used2=$rrd_file:used:AVERAGE:start=10/24/2009",
"DEF:used3=$rrd_file:used:AVERAGE:start=-1w",
"DEF:used4=$rrd_file:used:AVERAGE:start=-2w",
"DEF:used5=$rrd_file:used:AVERAGE:start=-4w",
"DEF:free1=$rrd_file:free:AVERAGE",
"DEF:free2=$rrd_file:free:AVERAGE:start=10/24/2009",
"DEF:free3=$rrd_file:free:AVERAGE:start=-1w",
"DEF:free4=$rrd_file:free:AVERAGE:start=-2w",
"DEF:free5=$rrd_file:free:AVERAGE:start=-4w",

"CDEF:pused1=used1,100,*,used1,free1,+,/",
"CDEF:pused2=used2,100,*,used2,free2,+,/",
"CDEF:pused3=used3,100,*,used3,free3,+,/",
"CDEF:pused4=used4,100,*,used4,free4,+,/",
"CDEF:pused5=used5,100,*,used5,free5,+,/",

“LINE1:90″,
“AREA:5#FF000022::STACK”,
“AREA:5#FF000044::STACK”,

"COMMENT:                         Now          Min             Avg             Max\\n",
"AREA:pused1#00880077:Memory Used",
'GPRINT:pused1:LAST:%12.0lf%s',
'GPRINT:pused1:MIN:%10.0lf%s',
'GPRINT:pused1:AVERAGE:%13.0lf%s',
'GPRINT:pused1:MAX:%13.0lf%s' . "\\n",
"COMMENT: \\n",

'VDEF:D2=pused2,LSLSLOPE',
'VDEF:H2=pused2,LSLINT',
'CDEF:avg2=pused2,POP,D2,COUNT,*,H2,+',
'CDEF:abc2=avg2,90,100,LIMIT',
'VDEF:minabc2=abc2,FIRST',
'VDEF:maxabc2=abc2,LAST',

'VDEF:D3=pused3,LSLSLOPE',
'VDEF:H3=pused3,LSLINT',
'CDEF:avg3=pused3,POP,D3,COUNT,*,H3,+',
'CDEF:abc3=avg3,90,100,LIMIT',
'VDEF:minabc3=abc3,FIRST',
'VDEF:maxabc3=abc3,LAST',

"AREA:abc2#FFBB0077",
"AREA:abc3#0077FF77",
"LINE2:abc2#FFBB00",
"LINE2:abc3#0077FF",

"LINE1:avg2#FFBB00:Trend since 24 Oct 2009                      :dashes=10",
"LINE1:avg3#0077FF:Trend since 1 week\\n:dashes=10",
"GPRINT:minabc2:  Reach  90% @ %c :strftime",
"GPRINT:minabc3:  Reach  90% @ %c \\n:strftime",
"GPRINT:maxabc2:  Reach 100% @ %c :strftime",
"GPRINT:maxabc3:  Reach 100% @ %c \\n:strftime",

;

my $ERR=RRDs::error;
die "ERROR : $ERR" if $ERR;
Very useful, thanks 🙂
This is one of the best RRD trick that I can find on the web, thank you & write more please. I look forward to seeing another magic trick from you.
How to show graph in future for prediciton. I am using rrdtools v1.2.23. Does HWPREDICT shows value in future? How to define that?
Thanks.
Archan
Can we format srfttime to show only month and yar instead of by default format?
@Archan Yes, here %c is used as a standard formatting (%c is “national representation of time and date”) but you do “GPRINT:maxabc2: Reach 100% @ %Y %m :strftime” if you want
@Archan I don’t catch the question, showing prediction is what the article talk about.
Great tips, got me started…
I didn’t like the “red” section with HRULE since what you see depends highly on the size of the graph (a bigger graph would show white space between the red line) I found a cleaner way to do the same and that would be consistent across any graph size.
Just replace the hrule block:
“HRULE:100#FF000044”,
….
“HRULE:90#FF000022”,
By those 3 lines
“LINE1:90”,
“AREA:5#FF000022::STACK”,
“AREA:5#FF000044::STACK”,
@MB
You’re right, I did not notice my mistake on that. Good solution, I updated the post.
Hi, thanks for share your great work!
I was wondering if it’s possible to don’t show the date if the trend don’t cross the line because it looks confusing.
For example here
http://oss.oetiker.ch/rrdtool/gallery/index.en.html
look at “Filesystem Utilization and Predicted Trends” graph.
Thansk!!
Thank you, thank you, thank you!
I’ve used this post to quickly hack up disk usage trend prediction into collectd’s collection.cgi: http://imgur.com/JAzco
I don’t suppose there’s a way to conditionally hide the ‘GPRINT’ when the trend line never hits 90 or 100%? Currently the graph claims a date of Jan 1, 1970 in that case.
How did you make it draw a nice diagonal line in the legend? As you can see in my screenshot, what I get is a square with a dashed border that looks a bit ugly.
Thank you for this great tutorial! Best demonstrative guide for RRD on the web so far 😉
Am I right that predictions of dates like 90% and 100% in your example are only available if drawn period exceeds predicted dates? What will happen if 90% and 100% memory load would happen in next year? 🙂
Great article!
Would it be possible to implement some easy notifications when a value (greatly) exceeds the trend?
@Marius Gedminas
I wrote a patch about this. It’s included in latest rrdtool version, it will display “-” instead.
@WASD
In my example it would not work but you can do something like
“DEF:used2=$rrd_file:used:AVERAGE:start=10/24/2009:end=31/12/2020” if you want to make the calculation append untill 2020
@Dries
Nope :/
I have tried something similar – but needs to forecast much longer in advance… But it seems like the tools doesn’t do as expected (I am trying to forecast storage usage)…
Do you know whether there is a limit on how long time can be forecasted ?
Great article. I have started with RRDtool yesterday and your example helped me a lot. Thanks!
I am building a very similar graph for storage capacity – predicting when certain thresholds might be reached.
I can find and print dates – no problem there.
But I would also like to calculate how many days are left before a threshold is reached.
Could you give me a hint?